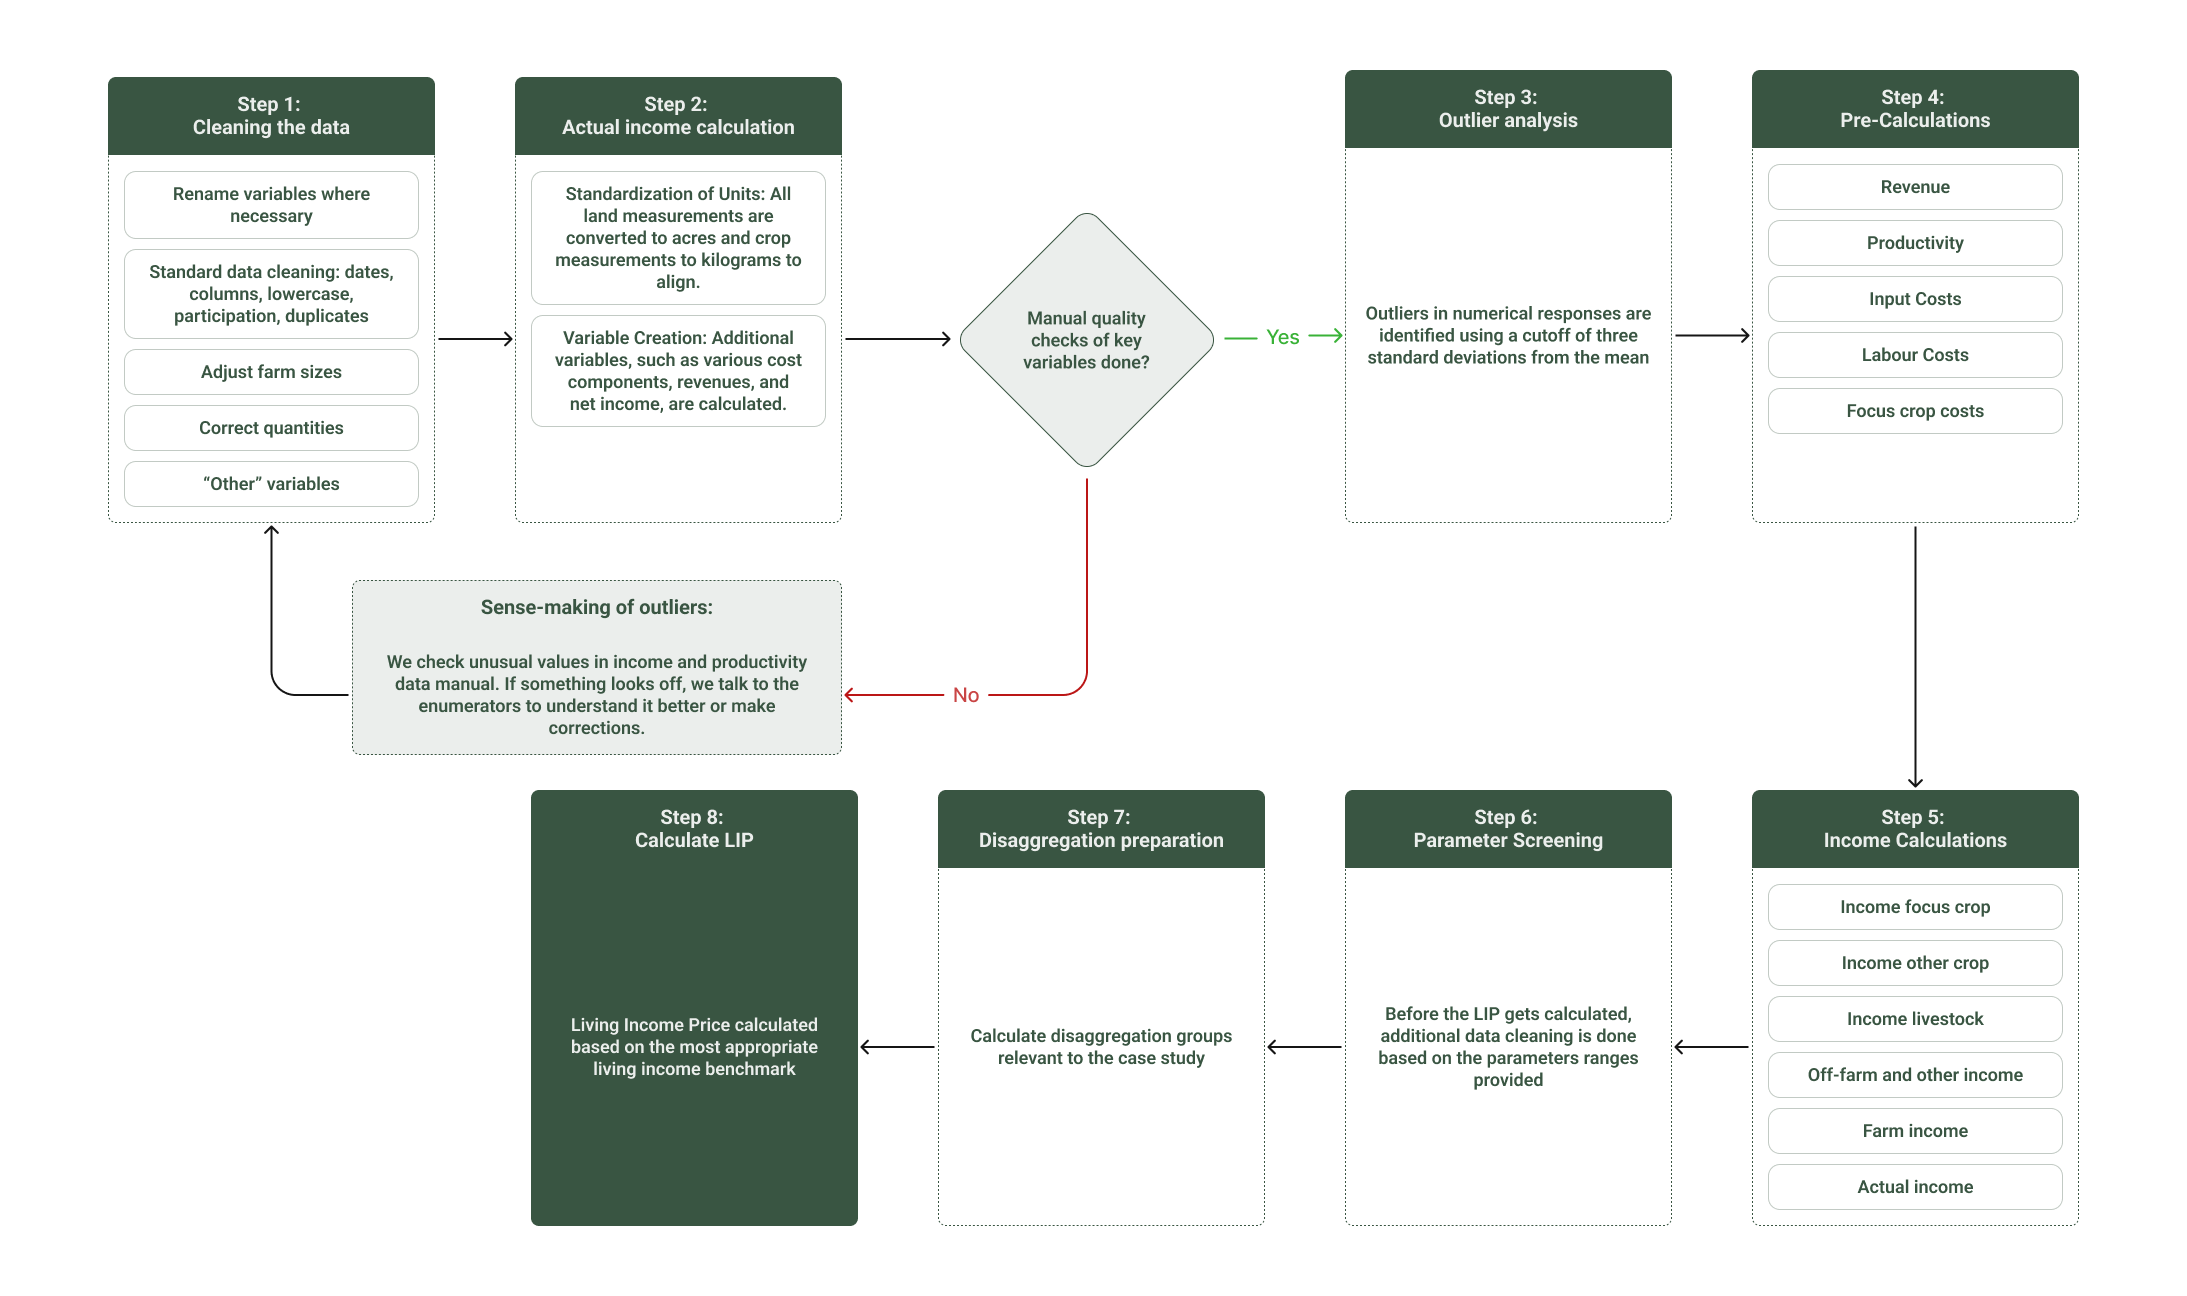
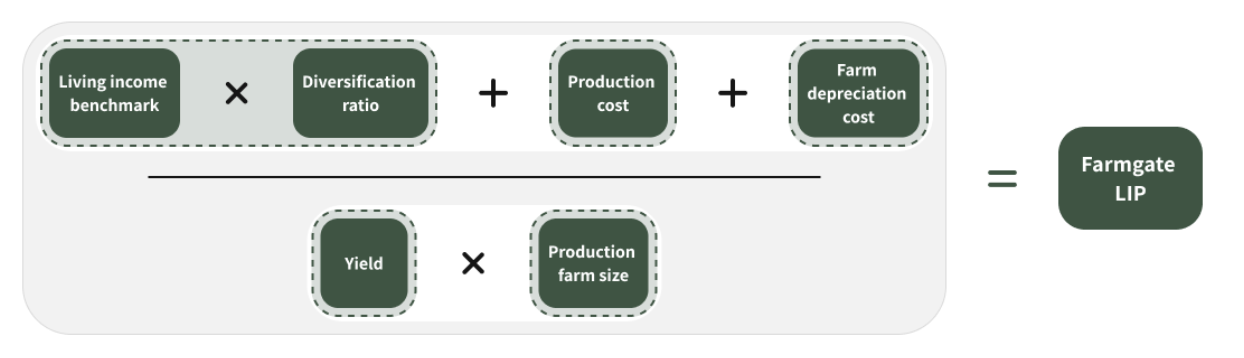
As seen in the overview above, the final part of the first R script is calculating the Living Income Price. Understandably, this is quite a crucial part of your calculations so let’s dive deeper into what that entails. The visual below provides an overview of the calculation.
Data analysis and visualisation
After data cleaning and calculation of all necessary variables comes the analysis, which you will find in the second R script called “Step 2: Analysis and input for slide-deck”. The script and presentation follow the same structure and include these sections:| Section | Goal | Questions Answered |
|---|---|---|
| 1. Sample | Understanding the farmers in your sample | How many farmers in the sample are women/youth/certified? Where are your farmers located? |
| 2. Income Sources | Assessing the role of the focus crop in farmer income | How much of farmer income comes from the crop? What other income sources do farmers have? What are other commonly grown crops? |
| 3. Production Cost | Getting insights into what makes up production cost | What are the most common cost drivers for farmers? What is the total cost of production? What types of labour do farmers have expenses for? |
| 4. Productivity | Comparing farmers based on production per acre | What is the median productivity per acre? How does this compare across different groups of farmers? |
| 5. Living Income Price | Exploring the LIP for different farmer groups | How high is the Living Income Price? How does it compare to the price farmers currently receive? Does the Living Income Price differ between groups? |
| 6. Interventions | Measuring impact of targeted interventions | By how much do interventions decrease the Living Income Price? |
Are pieces of the R script not working? Are you struggling to tailor the code to your dataset where variable names are slightly different? Asking ChatGPT or another AI Chatbot can be very useful to help you arrive at a working code without needing a lot of expertise. Final deliverable: Interactive slide deck
For sharing your analysis results, we recommend using Canva and Flourish. The combination of both platforms let you build an interactive slide deck, which means viewers can click on visual elements (for example, to switch currencies or drill down into specific breakdowns). Check out a live example of this interactive deck here. To get started, make a copy of our “LIP Presentation guidance” template. It contains editable example slides alongside step-by-step instructions for creating and customising your visualisations.
How to arrive at recommendations from the analysis results?
The data derived from the analysis can be used to develop targeted interventions to reduce or close the Living Income Gap. The interventions should be targeted to the specific context and there is no copy paste procedure here. The automatically generated heat-map at the end of the slide deck presents the scale of LIP reductions brought by different interventions. This is an option to ‘model’ the effect of specific interventions on the overall LIP. Additionally to this, coming to recommendations requires a ‘manual’ approach. This includes discussion with the several stakeholders in your project about the interpretation of the data and how to use this data to inform decision making around targeted interventions in your specific context. There are several ways to look at developing interventions.- Closing/reducing the LIP gap with price intervention: the difference between the median price and the median LIP provides an indication on the price intervention needed to close the living income gap. However, in many cases, the price gap is too big making it impossible to close the living income gap by price interventions alone
-
Closing/reducing the LIP gap with targeted interventions: the data provides other insights that can help define targeted interventions to further reduce the living income gap. The most common ones are:
- Income diversification: In cases where farmers highly depend on the income coming from the main crop or where prices are relatively low it is worth investigating income diversifying activities that do not interfere with the (land used for) the main crop. Intercropping, off farm activities, livestock farming, agroforestry and carbon credit models are examples.
- Reduction of labour/production costs: the data defines the most common drivers for production costs. This can be labour activities, inputs (seeds / fertilisers), materials, non-mechanic equipment. If high production costs are driving up the living income price gap it is worthwhile to investigate targeted interventions to reduce costs in the most common cost drivers. Common examples are seedling projects, good (regenerative) agricultural practices (training and/or fertiliser programmes).
- Productivity: low yields are another common denominator of living income gaps. Increasing productivity very often reduces living income gaps if the interventions are well targeted and will receive a return on investment in the near future. Common examples here are farm management training, renovation of plants/trees, agroforestry system, soil management/soil fertility programmes.
- Group disaggregation: As farmers are not one homogenous group with the same needs and problems, disaggregation based on their characteristics allows us to pinpoint specific needs / interventions. Furthermore, interventions can be targeted based on the disaggregations provided in the analysis (e.g. gender, age, region, certification status).
Sensemaking and data validation
Through organising local sensemaking sessions agency of data can be given back to the farmers that were part of the study. By validating findings with multiple stakeholders in the supply chains - first and foremost the farmers - accuracy, completeness and consistency of data can be checked, further enhancing data integrity and improving decision-making around targeting interventions. Two models have been tested: a workshop format (structured, with slides and interactive exercises), and a focus group format (smaller, more informal discussions). The first not only validates data but also helps participants build capacity around concepts such as Living Income and co-create solutions; while the latter allows for deeper conversation and insights within a more intimate group. Both served to return findings to farmers and other stakeholders, validate results and jointly explore implications for improving livelihoods. 1) Sensemaking workshop Through a sensemaking workshop with a relevant sample of farmers, data can be validated and input for decision-making can be retrieved. When selecting the participants for the workshop, it is important to ensure each of the disaggregated groups researched (gender, age, certification status, region) are represented. A following agenda can be kept:- Introduction of the project: a clear description of the project, the stakeholders, the objectives of the research and the sensemaking workshop
- Introduction to the concept of Living Income: to internalise the topic of Living Income a way of introducing it could be to ask participants to answer the following question: ‘what does a family need to have a decent life’? Followed by an internationally acknowledged definition of Living Income
- Interactive exercises: the discussion around the topic can be followed by a Living Income small-group exercise in which each group receives a given monthly income for the main crop and a budget sheet. The exercise can be done as follows:
- Cost of production exercise: The group calculates the cost of producing the main crop (e.g. labour, inputs, materials, non mechanic equipment) on a monthly basis.
- Expense exercise: The group makes an overview of the monthly household expenses (food, energy, housing, school, healthcare, others)
- Group discussion:
- Which household expenses can be met
- What expenses are prioritised
- Which expenses had to be left out
- What other sources of income are there, or which sources are needed
- Why is it important to understand the gap between income and decent income
- Bring back the discussion back to plenary and share learnings
- Baseline result presentation: a selection of the slide deck can be shared during the workshop. Make sure to use local language, valuta, metrics etc. Invite participants to respond to the results and verify if the outcomes of the research resonates.
- Improving livelihoods: follow the sharing of results with an interactive exercise (in smaller group) and organise discussions around the following questions:
- What are the barriers preventing you from having a good life?
- Can you prioritise the barriers or needs to improve livelihoods?
- What solutions or interventions could remove these barriers?
- What kind of support is needed?
- What successful interventions are already being implemented?
- Reflexions and next steps: conclude the session with summarising the main take outs of the workshop. Be clear on how the input will be used for future steps and / or setting up targeted interventions.