Who this guide is for
This guide is intended for organisations working in food supply chains, such as producer organisations, export organisation, NGOs, social enterprises, certification bodies, traders, or corporate sustainability teams, with the ambition of improving the living income of smallholder farmers. It is particularly suited to users who are involved in impact measurement, value chain development, or price-setting initiatives.What this guide is and what it is not
This guidance document outlines the methodology and steps required to carry out a Living Income Price (LIP) analysis. It supports users in developing a final slide deck that visualises the key findings of such an analysis. For each step in the process, we provide practical tools (including Excel templates, R scripts, and best practice documents) to help implement the methodology effectively. This toolkit is the result of a collaboration between Fairfood and Akvo, who have developed this lean version of the LIP analysis-approach based on field experience and iteration. While the guide is highly detailed and comprehensive, it is not a fully automated tool. Users will need to manually complete various activities, make context-specific decisions, and adapt tools where necessary. From scoping to survey implementation, analysis, and reporting, a realistic timeline for carrying out the full LIP analysis is approximately two months. This guide is not meant to be a plug-and-play product or a black-box model - it is designed for users who want to understand and be actively involved in each step of the process. The expected output of using this guide is a visually engaging slide deck that presents the key results of the LIP analysis and farmer income assessments. Insights include:- a clear picture of farmer incomes, where they come from, and how they compare to the living income benchmark
- a deep dive into production costs, yields, and productivity trends
- focused disaggregations that spotlight different farmer groups and their unique realities
- evidence on how four targeted interventions can boost farmer incomes
- A price analysis revealing insights on the Living Income Price
Whats needed for a successful LIP analysis
A successful LIP analysis depends on your ability to collect the required data. In some regions or value chains, farmers may not be used to tracking or reporting detailed cost and income information, which can affect the accuracy or completeness of your results. If you’re not deeply familiar with the context, consider connecting with those who are. Local experts can help determine whether the necessary data can be collected and the correct approach to make farmers comfortable with the process. Local knowledge will always enhance the credibility and quality of the data. Lastly, it’s worth noting that the current version of the survey builder has been tailored for the following crops: banana, coffee, cocoa, spices, and shea. Other crops might need tailored questions to account for income correctly.Minimum skills required to use the toolkit
To use this toolkit effectively, users should possess the following baseline skills:- Survey and sample design: Understanding how to frame relevant questions and select a representative sample of respondents is crucial.
- Familiarity with indicator frameworks: Users should understand basic concepts like household income, production costs, and farm profitability.
- Basic R skills: Data cleaning and analysis are performed using R scripts, so users should be able to run scripts, adjust parameters, and troubleshoot errors.
- Data analysis literacy: Users should understand foundational statistical concepts such as averages, medians, and standard deviations.
- Excel proficiency: The survey design tool is Excel-based and will be uploaded to KoboToolbox for data collection.
- Optional but helpful: comfort using Canva and Flourish to create engaging visuals in the final slide deck.
Process Overview
The Living Income Price (LIP) analysis follows a clear three-phase process: Scoping and preparation, Data collection, and Analysis and recommendations. Each phase includes key activities that build toward a robust and context-specific LIP outcome. During the Scoping and preparation phase, users define the goals, design the survey, and prepare for fieldwork. In the Data collection phase, enumerators are trained and fieldwork is conducted with ongoing data quality monitoring. Finally, the Analysis and recommendations phase involves cleaning and analysing the data, generating key insights, and visualising results in a final slide deck. This structured process ensures that the LIP analysis is both rigorous and practical, while remaining adaptable to different local contexts.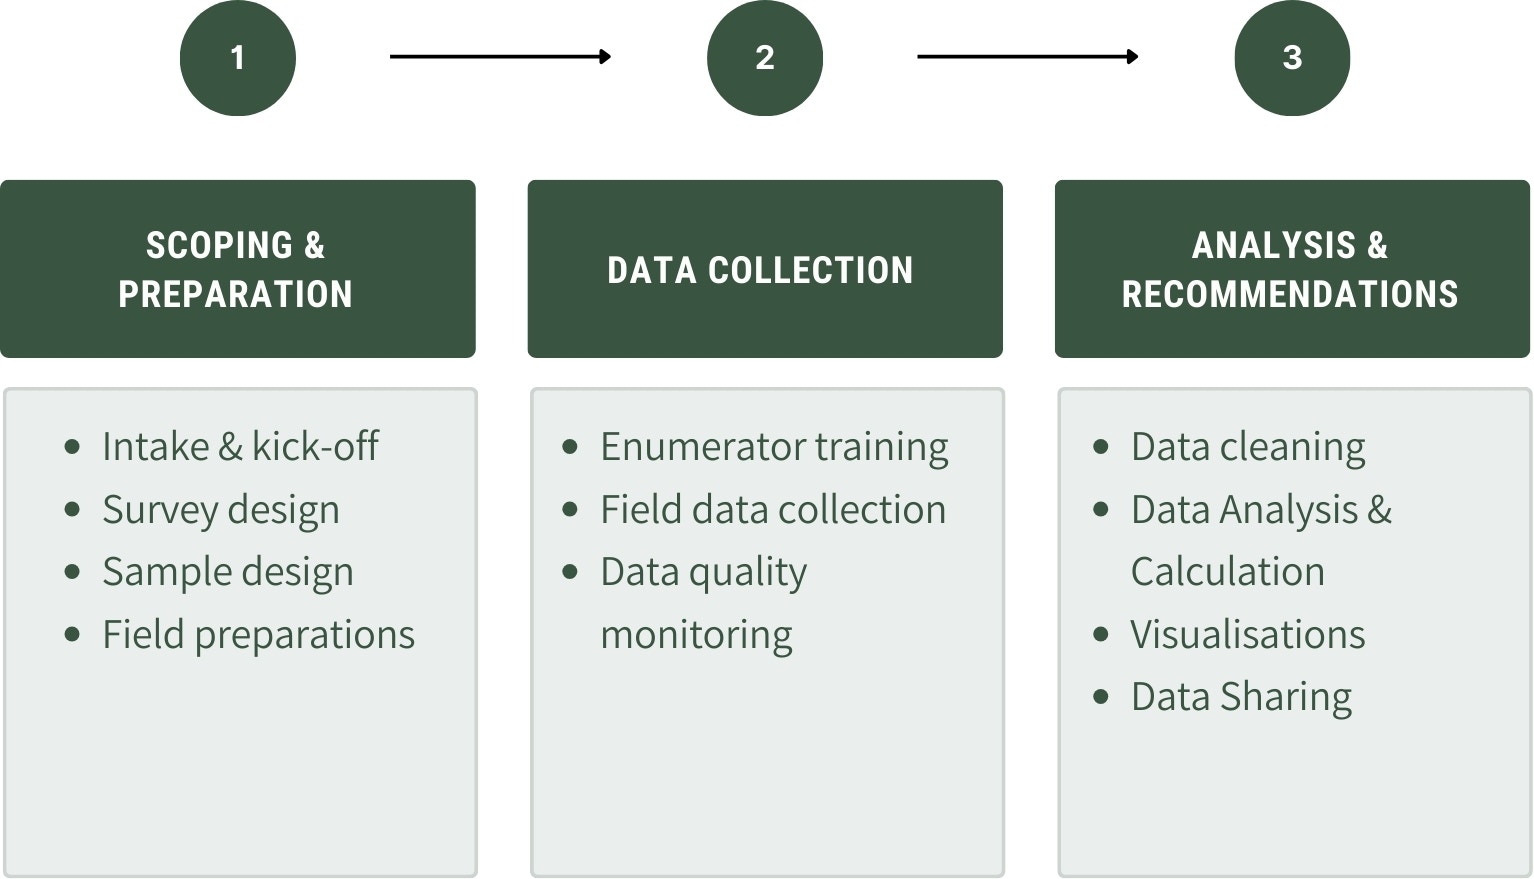
Contact for Support
This toolkit is designed to meet you where you are - whether you’re just starting to measure income gaps or ready to co-create a pricing strategy with producers. Explore the tabs to get started, and remember: the process is modular, so you can go at your own pace, one step at a time.- For technical support, data collection guidance, or help using the toolkit, contact: info@akvo.org
- For insights on how to integrate this into your sustainability strategy or project design, contact: info@fairfood.org